
White Paper
How to Make the Journey from Basic to Advanced Infrastructure Monitoring
Signs your current monitoring strategy is failing you, and what steps your organization can take to
step up your infrastructure monitoring
by Bob Moul

Times are changing fast and technology continues to advance at an unrelenting pace. An explosion of systems and devices, complex architectures, pressures to deploy faster, and demand for optimal performance have placed greater and greater strain on infrastructure monitoring teams. Add to that the surge in demand for online services, which is exposing weaknesses in, and in some cases a total lack of, adequate monitoring practices.
Anecdotally it seems we’re seeing increasingly more outages of online websites and services. Operations teams are scrambling to keep up while demands on the business continue to increase. For many companies, their current monitoring strategy and tools are just not enough.
It’s like a perfect storm, and these dynamics are only going to accelerate. If your organization is already feeling the pinch of the new normal, then it’s time to up your monitoring game to not only keep pace with what’s happening today, but also to prepare for what’s ahead in the coming months and years. In this paper, you’ll learn:
- Trends driving the need for advanced monitoring
- Signs your current monitoring strategy is not enough
- Steps on how to make the journey from basic to advanced monitoring
- The art of the possible with advanced monitoring

Technology Trends Driving the Need for Advanced Monitoring
Successful monitoring boils down to the ability to harness and analyze all the machine data (also known as telemetry or metrics) from all your infrastructure in real-time to ensure you are meeting your quality of service objectives. The power and value of monitoring increases dramatically the more you can harness all of your machine data to confidently make the best decisions for your organization. The challenge is that machine data is growing exponentially and the budgets to make sense of it all are not. Here are some of the trends that are driving this phenomenon:
- Continued adoption of cloud and hybrid-cloud computing. Spending on cloud computing continues to rise with a recent Flexera survey showing budgets increasing by 50% and Gartner projecting that the market as a whole will reach $330B in the next few years.
- Adoption of virtualization, containerization, and serverless technologies. A typical server generates something in the neighborhood of 150–200 metrics whereas a typical container will generate 1000 times that amount.
- IoT deployments. In a recent cover edition on IoT, The Economist talked about a world with a trillion connected computers. IDC estimates that the IoT will generate some 79.4 Zettabytes of data by 2025.
- 5G applications and edge processing. According to Verizon, the 5G standard will support millions of devices per square mile and is designed to support up to 10 TB/s/km28 in data volume.
- Digital transformation initiatives. An IDC survey from 2018 suggested nearly half of all businesses were in the “very early stages” of digital transformation and that only 7% had completed their journey.
The volume of machine data is exploding so rapidly, it’s virtually impossible to quantify. Theo Schlossnagle, founder and CTO of Circonus and widely respected computer scientist, estimates that machine data is growing at the rate of 1×10¹² every ten years.

Signs Your Current Monitoring Solution may be Failing You
Many businesses are finding that their current monitoring solutions and practices are not keeping pace with this evolution of technology and the associated increase in machine data generation. How do you know if you fall in this camp? Here are some sure signs to look for:
- Being Blindsided. It’s never fun when the first indication you have of problems in production is complaints from customers. It could be that your monitoring solution just needs to be better configured, but it could also mean it has limitations on the amount of data it can collect, there’s been data loss, or delays in the ingestion of data for analytics.
- Preventable Outages and False Positives. In this scenario, you are experiencing too many preventable outages on the one hand or too many false positive alerts on the other. This could either be a case of not monitoring what you actually care about or you know exactly what you care about, but your monitoring solution can’t express what you want to monitor.
- Bad Data. You spend hours studying a graph to isolate a problem only to find out the data you’ve been analyzing is either wrong or outdated. This can happen when you’ve had to compromise and store summary data to save space and/or cost, and you lose the drill-down granularity you need for root cause analysis and other analytics.
- Missing Data. You have urgent operational and business impact questions but turns out you haven’t been collecting the data you need to answer them. This typically happens when your monitoring system is limited in its ability to collect and retain the massive amount of machine data generated by today’s modern infrastructure.
- Monitoring Crashes. Your monitoring solution is actually less dependable than the systems it monitors, and you lose data when it crashes. Be careful of solutions with single points of failure and/or that need to be deployed within the actual “blast zone” (of a potential outage) in order to collect data.
If any of these symptoms sound like you, there’s a good chance that your monitoring efforts need a tune-up. The good news is that these issues can indeed be fixed, and the return on investment is well worth the time and effort.
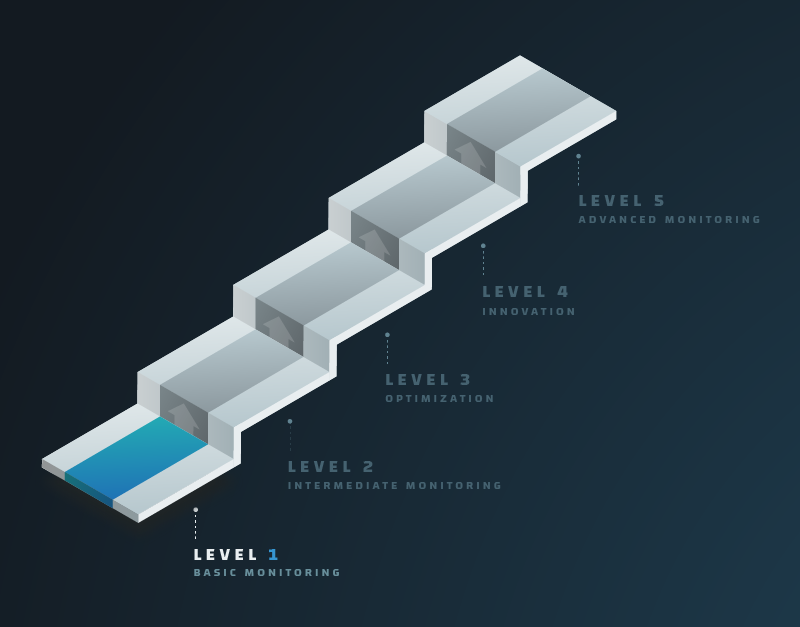
Making the Journey from Basic to Advanced Monitoring
Developing monitoring expertise is a journey. It begins with implementing the fundamental building blocks and then layering on increasing sophistication over time. At Circonus, we’ve developed a capability maturity model to help people make this journey — by helping you recognize where you are today, where you want to go, and then laying out the steps to get there. It starts with “basic monitoring” and progresses through advanced monitoring, data-driven operations, and culminates with full “machine data intelligence.”
One of the hallmark characteristics of a basic monitoring approach is that it’s very tactical and reactive. At the basic monitoring level, the organization has multiple teams all using disparate monitoring tools for their specific purpose and creating silos of metric data. It’s a patchwork environment where there is a lack of standards and consistent processes and as a result, there’s no ability to share information in a clear and cohesive way among different teams within the organization.
Systems and applications are configured differently, monitored differently, and measured differently. Analyses like comparing the KPIs of one Kubernetes cluster to another are impossible because there’s no way to do a true “apples to apples” comparison. There’s also no ability to search and correlate all the metrics that the various monitoring tools are collecting because metrics are formatted differently and/or lack sufficient context. Critically for executive management, there is no way to get a comprehensive and consolidated view of the health and performance of the systems that underpin the business.
And operational inefficiencies abound. Services are provisioned ad-hoc by various teams and without centralized tracking they fall off the radar screen. Over time, services get shut down but the associated infrastructure is forgotten. Costs and metrics continue to pile up unabated.
At this stage, all your charts and graphs may look great, but you’re only one misstep away from a potential catastrophe. And when that catastrophe happens, only then do companies realize that an event threatening their organization’s brand or bottom line could have easily been surfaced with unified, comprehensive monitoring. It’s usually a painful outage like this that leads companies to re-evaluate their monitoring practices and solutions. It may even be what led you to read this paper.

Elevating to Advanced Monitoring: 5 Critical Steps
As you move towards advanced monitoring, operations become far more strategic and proactive. Organizations move from fire-fighting to driving measurable business performance and results. In an advanced monitoring environment, an organization has established organizational-wide monitoring by consolidating and rationalizing its monitoring and data collection capabilities across the enterprise. It has built a solid foundation on which to begin deriving additional value from monitoring data for use cases such as streaming analytics, fault/anomaly detection, root cause analysis, service level objectives (SLOs), and error-budgeting.
There are 5 foundational components that are absolutely critical to achieve this level of operations.
1. Organizational Buy-In
The importance of this aspect cannot be overstated. You will be limited in your ability to generate results to the degree that everyone in the organization buys into the vision and goals of a comprehensive, consistent, and unified approach to monitoring. It is imperative that leadership establishes a data-driven culture that embraces and values the benefits of unified monitoring. Leaders up to and including the CEO need to make it a clear mandate and priority but they also need to take the time to impress upon all team members the strategic importance to the business, to explain the “why.” Why monitoring is so critical to business success and why decisions are being (or will be) made to change the way monitoring has been done up until now.
2. A Comprehensive Inventory of Services and Infrastructure
At the heart of a robust monitoring program is an always up-to-date inventory. Start by identifying all the services you are running and the resources they depend upon. Document what services are running, where they are running, how they’re running, why they’re running, what they do, what they connect with, etc. Develop a plan and procedures through which when new services and infrastructure get provisioned, they automatically move into the inventory and get monitored by default. (Over time, your monitoring platform should in essence become the system of record for all services and related infrastructure.)
3. A Monitoring Plan Linked to Business Success
What should we be monitoring? Believe it or not, that simple question can nearly bring about an existential crisis in the business causing companies to really question what they do and why. It’s a great mental exercise to ask (not that you would, but), “If we could only monitor one KPI, one metric, one telemetry point, what would it be?” Do this exercise with a cross-functional team across the business and you’ll get a range of answers. You’re on your way to really understanding what’s important to the business and therefore what you should be monitoring to ensure you meet those goals. (By the way, if no one is up for doing this exercise, you probably need to revisit step one.)
4. A Unified Monitoring Platform that is Metrics 2.0 Compliant
All of the above is critically dependent on implementing a centralized monitoring platform that has the capacity to consistently collect, correlate, share, and present all your metric data from all of your infrastructure in use by all of your teams in real-time. A centralized platform consolidates the monitoring efforts across all teams within the organization and enables the business to extract the maximum value from its monitoring efforts.
It’s also important that your monitoring tools be Metrics 2.0 compliant. Metrics 2.0 requires metrics be tagged with associated “metadata” or context about the metric that is being collected. When all metrics are tagged in this manner, queries and analytics become quite powerful. You can search based on these tags and you are able to slice and dice the data in many ways to glean insights and intelligence about your operations and performance.
5. A Commitment to Learn and Iterate
Finally it’s also critical that the business adopt a philosophy of continuous improvement. It’s more important to get started and iterate over time than to shoot for immediate perfection. Start with an initial inventory and then ensure new services and infrastructure are automatically added to your inventory and monitored by default. Build your initial monitoring plan in collaboration with business leaders, set what you believe to be acceptable performance levels, and measure results. Then meet regularly with business leaders to share data and results and further refine your monitoring plan. It’s a journey and an iterative process — one in which there is always room for improvement.

Data-Driven Operations: The Art of the Possible with Advanced Monitoring
With the requisite organizational buy-in and a monitoring program that is linked to business success, you are now ready to take your monitoring to the next level: data-driven operations. At this stage, many organizations have progressed to implementing a DevOps culture and/or Google SRE best practices. One of the main goals of these practices is to deploy software faster with less risk. Let’s look at how that’s done.
Implementing and Measuring Service Level Objectives (SLOs)
DevOps helps determine how to properly balance risk and innovation by creating SLOs. SLOs are an agreement on an acceptable level of availability and performance and help minimize confusion and conflicts between IT functions. Setting an SLO is about setting the minimum viable service level that will still deliver acceptable quality to the consumer. This is critical. It’s not the best you can do, but rather an objective of what you intend to deliver. It is the foundation for creating error budgets, which we’ll discuss next.
Creating your SLOs is dependent on highly precise infrastructure performance analytics. However, all too often, organizations select arbitrary SLOs. There can be big differences between 99%, 99.9%, and 99.99%. SLOs are supposed to provide business outcomes, but when they’re framed incorrectly, a common problem, suboptimal business decisions can be made that cost time, money, and resources. Having the right monitoring and analytics platform in place — one that will provide the correct math, historical metrics, and the ability to correlate metrics — is critical to calculating your SLOs correctly and avoiding those costly mistakes.
Creating Error-Budgets
So how do we safely introduce changes to production, and moreover how do we know if we could deploy faster or if we should slow down? Enter the error budget.
Because we know the level at which our systems are capable of performing and the level that still provides an acceptable experience to our customers, we can now define an “error budget,” which is essentially the difference between these two metrics. For example, if you have an SLO of 99.5% uptime and actually reach 99.99% on a typical month, consider the delta to be an error budget — time that your team can use to take risks. You are in essence “budgeting for failure” and building some margin of error into your SLOs. This will give you a safety net for when you introduce new features or experiment to improve system performance.
The error budget is a data-driven way to make decisions on balancing risk and innovation. If you’re consistently not meeting or getting close to not meeting your SLOs, then it’s time to dial back. Conversely, if you’re exceeding goals, then dial up the innovation and deploy more features. Like SLOs, the error budget ensures teams are aligned on when to slow down or speed up, and is therefore another effective tool for DevOps to bridge the gap between developers and operators.

The Rewards of Advanced Monitoring
So, you might rightly ask, what do I get if I go through the trouble of making all these changes? What’s the upside? Well first and foremost, you will have moved from being a reactive service provider, no doubt viewed as only a cost center in the business, to a strategic business partner able to help drive tangible business results. But you’ll get a host of other benefits as well:
- Avoid being blindsided by preventable outages
- Faster problem identification and resolution time
- Meet your SLAs
- Deploy software faster with less risk
- More confidence and speed in your decision making
- Deliver exceptional quality of service to end users
- Better sleep at night
For some organizations, basic monitoring processes and tools may be enough. But for others, it’s just not sufficient. The systems that run your business need to be the best they can be, but the system you use to monitor them needs to be even better. You need complete visibility and command of all the data from all your infrastructure. The power and value of monitoring grows exponentially the more you can harness all your metric data to confidently make the best decisions for your organization. Any monitoring tool will “work” — that is until something goes wrong. If you’ve been putting off making the changes to your operational and monitoring practices that you’ve known you need to make, now is the time.