
eBook
Monitoring & Observability Maturity Model
A multi-level framework for achieving advanced monitoring and observability at scale

The amount of data being generated in the world today is growing exponentially – some say it’s doubling every 7-8 months, and at Circonus we estimate that the amount of telemetry data (the metrics, events, logs, and traces being generated by applications and infrastructure) is growing even faster. Data has surpassed oil as the most valuable asset on the planet.
Collectively, the real-time telemetry being generated by nearly every modern business in the world is actually giving rise to “instant economics” as recently described by The Economist: “The world is on the brink of a real-time revolution in economics, as the quality and timeliness of information are transformed.” The typical enterprise is practically drowning in telemetry data and only tapping a small percentage of its potential value. We have only begun to scratch the surface of what telemetry can tell us – it is an entirely new frontier of business intelligence.
What’s driving this proliferation of telemetry data?
First, technology is advancing at an unrelenting pace. In the last decade alone, we’ve seen the advent of virtual machines, containers, microservices architecture, serverless, and edge computing. Work is already underway to redesign computer chips, design fundamentally new architectures, introduce 6G networks, and deliver the next generation of the internet itself with Web 3.0.
Second, the world is automating, digitizing, and becoming ever more interconnected. It’s been estimated that within the next 15 years, there will be a trillion connected computers and devices on the planet. Digital transformation will continue unabated as enterprises seek to achieve ever greater productivity gains, innovate product offerings, and uncover new sources of competitive advantage. Organizations have moved from needing a “web presence” in the 90’s to being a fully digital and integrated enterprise today. Saying that infrastructure and applications are at the heart of the enterprise is almost to understate it – in many, many cases (think B2B2C) that infrastructure is the business which means system performance equals business performance.
All that to say, “monitoring,” broadly defined, is no longer a nice-to-have. In this new digital economy, where the reliability and performance of our digital infrastructure is vital to business success, and where the telemetry being generated by that digital infrastructure is an incredibly rich source of real-time business intelligence, enterprises must implement more advanced monitoring and observability. Advanced monitoring and observability empowers enterprises to fully leverage their data in a way that allows them to improve operations, deliver high quality digital services, and gain competitive advantage.
So how do you get started? Where do you start? This eBook was developed to help enterprises develop a strategy and a game plan to implement advanced monitoring and observability and begin to reap its benefits. It is based on a capability maturity model not unlike maturity models for software development. It consists of five easy-to-understand levels of maturity and practical suggestions on how to move from one level of maturity to the next. Like any good framework, you can plot where your enterprise fits today, determine where you’d like to be, and then develop a plan to close the gap. You may find yourself at the earliest stages of this model. Don’t despair. You are not alone, but the competitive landscape is moving quickly.
The Circonus Monitoring & Observability Capability Maturity Model is a multi-level framework that helps you to identify the current situation of your enterprise and next steps to take, including:
- What should be improved at the stage you’re currently in
- Capabilities needed to master a level
- What your maturity should look like upon completion of a level
- The must-haves for moving to the next level
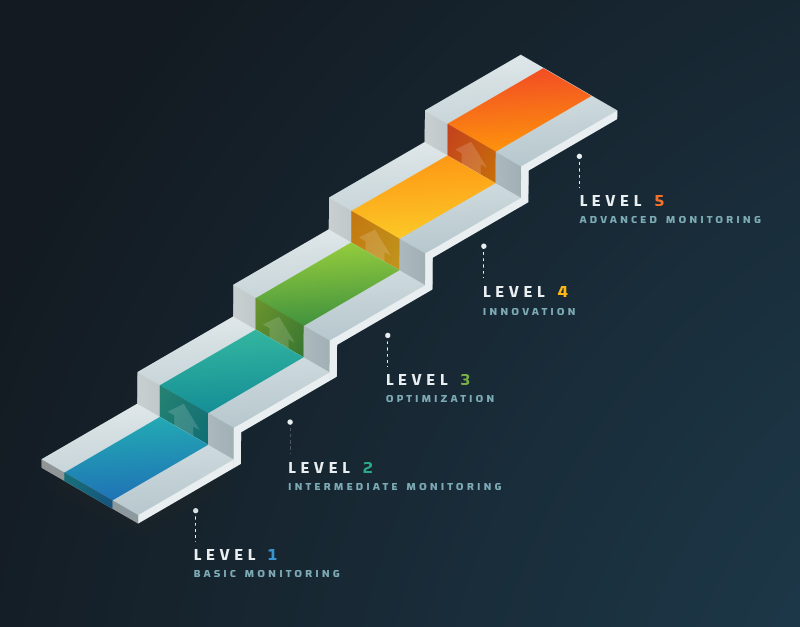
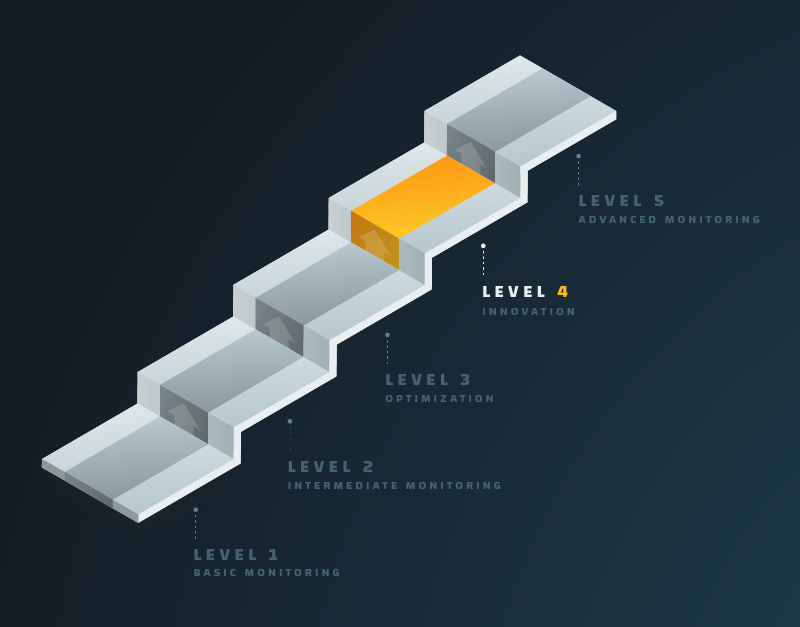
Maturity Model Chart
The Maturity Model consists of 5 levels:
- Level 1: Basic Monitoring
- Level 2: Intermediate Monitoring
- Level 3: Optimization
- Level 4: Innovation
- Level 5: Advanced Monitoring
What’s Your Business’s Monitoring & Observability Maturity Stage?
Level 1: Basic Monitoring
In level 1, there is no overarching monitoring and observability strategy for the enterprise. It is likely that a complete inventory of all machines and associated metric streams does not exist. There is some monitoring of IT infrastructure, but there is a lack of standards and consistent processes. No attempt is made to telemetry data for more advanced uses like predictive maintenance. Monitoring and observability is not a strategic objective for the company and does not have visibility in the C-suite.
Level 2: Intermediate Monitoring
In level 2, enterprises have invested heavily in monitoring tooling, but they are using multiple tools and platforms — resulting in disparate data sources, no single source of truth, and the inability to aggregate data easily across the enterprise. There is no centralized platform for the collection, storage, and subsequent analysis of machine data. Awareness of, and interest in, advanced monitoring and observability is rising but there is not yet a corporate objective to build a comprehensive strategy.
Level 3: Optimization
In level 3, the enterprise has consolidated and rationalized its monitoring and data collection capabilities across the enterprise and has built a solid foundation on which to begin deriving additional value from telemetry data. At this stage, the enterprise is using data to optimize device performance, implement predictive analytics and maintenance programs, and optimize company operations. The enterprise begins to move from intermediate monitoring into optimization of product and service delivery, and monitoring and observability is becoming a topic of discussion in the C-suite.
Level 4: Innovation
In level 4, the enterprise begins to move into true intelligence mode. It’s optimizing operations and product and service delivery and, as a result, realizing significant efficiencies and impact to its bottom line. At this stage there is a bedrock foundation of rich data, and multiple business units are using a sophisticated monitoring and observability platform to innovate new products and services. Entirely new potential revenue streams such as packaged information products are beginning to be identified. A company champion emerges and work begins on an overarching monitoring and observability strategy.
Level 5: Advanced Monitoring
In level 5, there is a cohesive and comprehensive monitoring and observability strategy in place for the entire enterprise. It is a strategic imperative of the company with executive sponsorship at the CEO level. At this level, all systems and metric streams have not only been identified but also mapped to strategic corporate initiatives. All business units are leveraging telemetry data to drive innovation in products and services, and there are frequently new ideas for monetizing this data and creating entirely new revenue streams. Monitoring and observability has become a strategic competitive advantage and is driving both top line revenue as well as bottom line profitability.
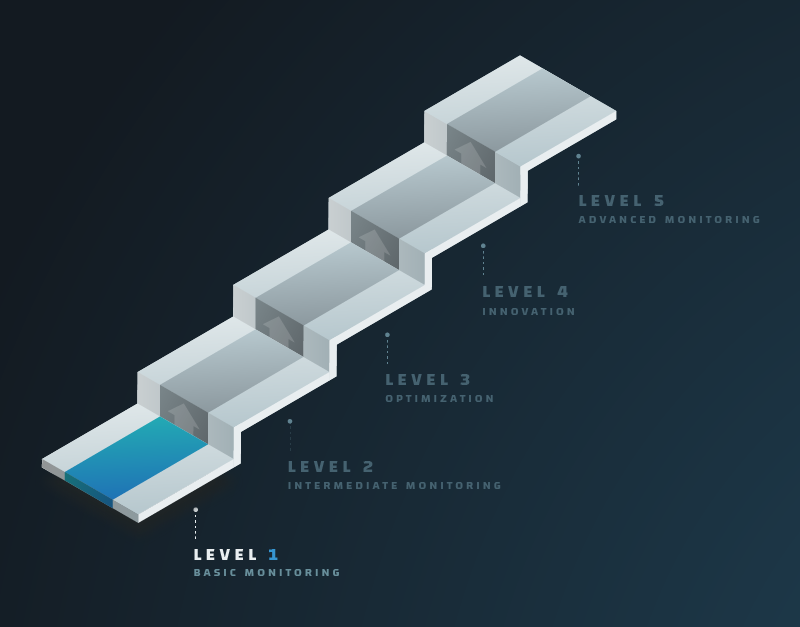
Level 1: Basic Monitoring
At this level, some monitoring is likely to be occurring but conducted in an inconsistent and patchwork way, typically according to the preference of individual staff and developers. There is a lack of a defined and communicated organizational mandate outlining what and how to monitor across the enterprise’s IT organization, and what the results of a monitoring effort should be. Consequently the business is unable to monitor their systems and services in any uniform manner which prevents them from surfacing value from those efforts.
What this level looks like
- No defined standards on what and how to monitor across the enterprise’s IT organization.
- No inventory of systems, services, or custom applications.
- Monitoring is done inconsistently and according to individual staff and developer preference.
- Disparate tools are being leveraged by different functions within the organization.
- Systems and services are not being monitored in a uniform manner, providing little to no value.
Capabilities required
- Technical expertise to create an inventory plan and permissions to execute upon that plan.
- Technical expertise to add monitoring for existing and future infrastructure and core services.
- Creation or identification of tooling or libraries through which to solicit or submit application monitoring metrics.
Checklist to move to the next level
- Identify a platform through which to consolidate your monitoring and subsequent analytics efforts.
- Create a comprehensive inventory of existing infrastructure, services, and applications.
- Create a plan through which the business identifies and defines the specific metrics and KPIs it expects to collect from its infrastructure, services, and applications.
- Establish observability standards for all physical, virtual, cloud, and container infrastructure, along with any services and custom applications.
The completion of this level’s requirements leaves the business with a well-defined “monitoring plan” of the assets to monitor, why to monitor a specific asset, and how specifically to monitor it.
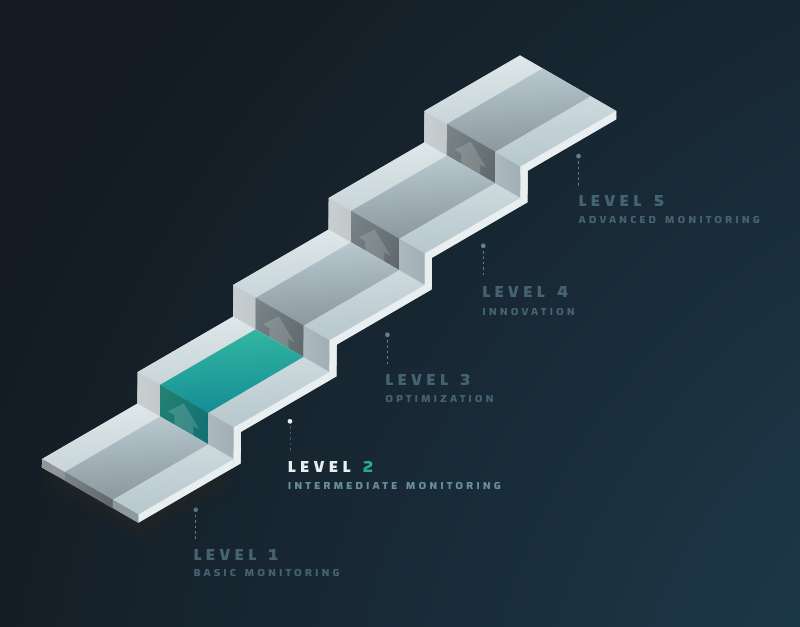
Level 2: Intermediate Monitoring
While much of the effort from the previous level was done manually, the advanced monitoring stage is where everything is automatically and uniformly monitored. There is a single, consolidated monitoring platform in place for the purposes of infrastructure, service, and application monitoring. A defined and communicated set of standards that outline the monitoring of infrastructure, services, and applications is in place. There is a comprehensive inventory of infrastructure, services, and applications and all are monitored according to standards.
What this level looks like
- Business has a monitoring plan with a well-defined set of standards on the monitoring of infrastructure, services, and applications.
- There is a comprehensive inventory of infrastructure, services, and applications.
- There is a centralized platform for the collection, storage, and subsequent analysis of metrics.
- Monitoring is consolidated into the centralized monitoring platform and disparate, legacy monitoring tools are removed.
- Inventoried assets are monitored in accordance with the monitoring plan.
Capabilities required
- A centralized, performant platform through which to consolidate the business’s monitoring efforts. Specifically a platform that can monitor physical/virtual servers, cloud services, containers, commonly encountered services, and custom application metrics.
- Fully automated monitoring for all provisioned infrastructure and services.
- Technical expertise to incrementally retrofit existing applications to emit metrics through agreed upon tooling or libraries.
- An SRE and a DevOps function to ensure that all freshly provisioned infrastructure and services are monitored by default, while also providing enforcement of agreed-upon monitoring standards for custom applications.
Checklist to move to the next level
- Conduct staff training on the usage of the identified centralized monitoring platform and overall capabilities.
- Create a set of standards and guidelines for SRE and DevOps within the business, and create a plan through which freshly provisioned infrastructure, services, and applications are automatically monitored.
- Enforce standards and guidelines for software development within the business to ensure consistent and comparable metrics.
The conclusion of this level effectively guarantees comprehensive, uniform, and cost-effective monitoring even in the event of staff churn, hypergrowth, etc.
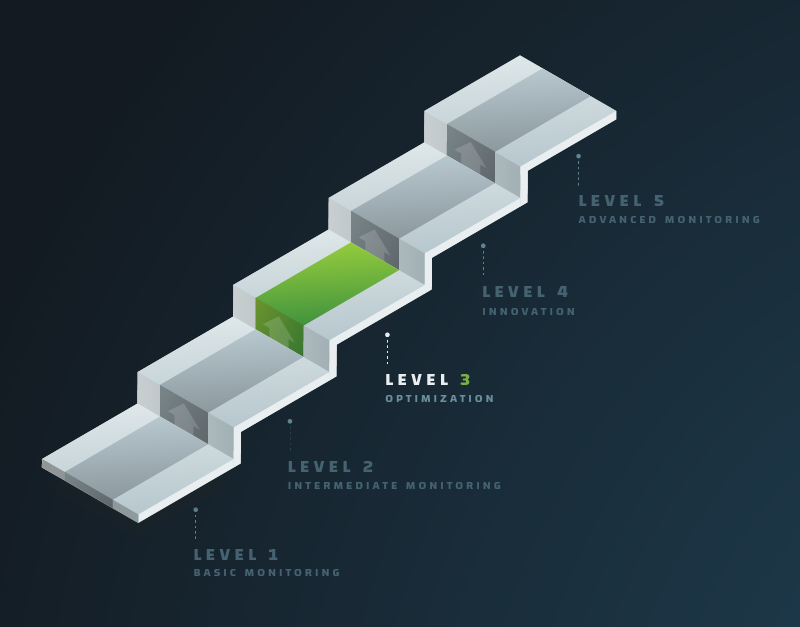
Level 3: Optimization
At the optimization level, businesses begin to use and leverage the data that’s been collected to identify new opportunities for improvement. Workflows are created to push the resulting intelligence to the necessary roles within the business to ensure proper budgeting and execution. The key to capitalizing on optimization opportunities is the ability to capture all the data at the speed and frequency it is being generated and the ability to retain that resolution of data without limit. The greater the density and richness of the data, the greater the accuracy, precision, confidence, predictive qualities, and insights.
What this level looks like
- Workflow and processes are in place to enable consistent and uniform monitoring of metrics.
- There is a centralized platform for the collection, storage, and subsequent analysis of metrics.
- High volume, high frequency metrics are collected across a wide spectrum of metrics streams or sources.
- Analysis of the collected metrics is conducted to inform efficiency and operational improvements.
- Workflows that ensure the resulting intelligence are shared within the organization for proper budgeting and execution.
Capabilities required
- Staff with the necessary skills and time to extract actionable insights from the centralized intelligence platform.
- Processes and workflows in place to facilitate the identification of opportunities for operational and efficiency improvements.
- Processes and workflows in place to communicate findings up to managers and executives.
- Additional platform capabilities, including real-time alerting, anomaly and fault detection, outlier detection, and trend analysis.
- SLO/SLA monitoring and altering.
Checklist to move to the next level
- Analyze collected metrics and draw conclusions about existing workflows and processes.
- Facilitate platform training for engineers and data science teams to broadly leverage the data moving forward.
- Develop processes and workflows to facilitate the identification of opportunities for operational and efficiency improvements:
- Create reports that show what has happened previously, and what’s happening now.
- Quantify the impact of software improvements, as well as outages, etc.
- Generate predictive analytics.
- Develop processes and workflows to communicate findings to managers and executives.
- Identify executive sponsorship and a company champion.
Completion of this level results in a business now able to effectively leverage the collected data. Concrete opportunities for improvement are identified and workflows are created to push this information around the organization to those who need it.
Level 4: Innovation
At the innovation stage, enterprises move into greater intelligence related activities by employing advanced analytics. Tapping into the full value of telemetry data can be transformational, delivering real and measurable results. The key to unlocking this enormous potential is the ability to harness and make sense of the wealth of data already being generated in the enterprise. The ability to gather and analyze vast amounts of data from IT infrastructure, sensors, systems, and connected devices, achieves new levels of insight that drive smarter operations, better decision-making, and new business opportunities.
What this level looks like
- All SRE and DevOps teams in all departments and functions have access to data assets and advanced analytics capabilities.
- The company’s inventory of data assets is mapped to strategic company objectives to identify potential opportunities.
- Opportunities are ranked by completeness and density of data assets and highest priority objectives.
- Ideation techniques are employed to foster creative thinking.
- Time and money budgets are allocated appropriately.
Capabilities required
- Performant analytics query language with high fidelity data science functions.
- High frequency, real-time streaming analytics.
- Anomaly and fault detection.
- Outlier detection and trend analysis.
- Historical analytics.
Checklist to move to the next level
- Executive sponsorship and buy-in at the C-suite level.
Completion of this level results in a business that is in command of all of its telemetry data and quickly moving to the forefront among its industry peers. The business is now not just finding new sources of competitive advantage but completely reinventing the ways services and products are delivered and has become a disruptor in its industry.
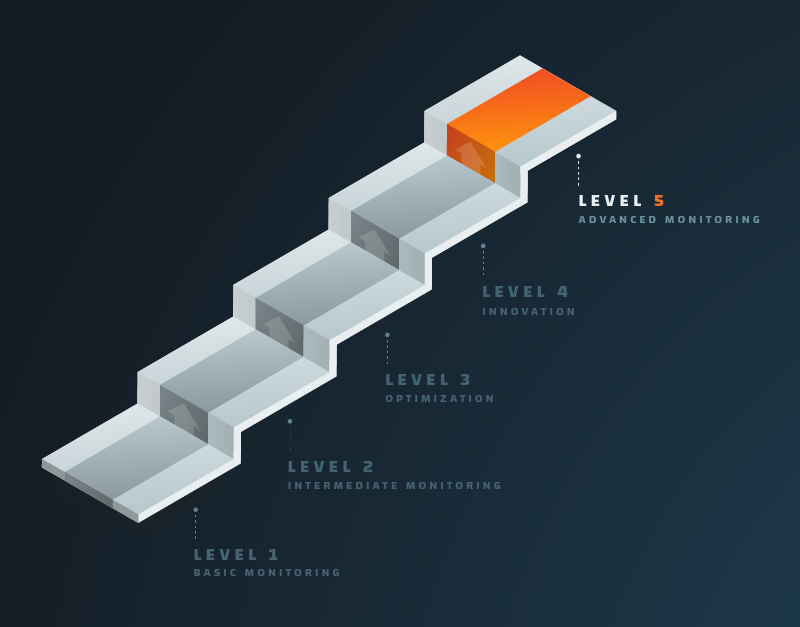
Level 5: Advanced Monitoring and Observability
At this level, a business now has the requisite data stored within a platform, methods for accessing and leveraging that data, staff to perform the necessary work, and processes and workflows in place to communicate conclusions to the necessary staff within the business. Businesses at this level are able to collect and ingest incredibly high volume and high frequency data. They can retain, find, and quickly retrieve data, as well as execute sophisticated and complex real-time, historical, and predictive analytics against that data. Data can be mined at will, without compromise or constraints — unlocking unprecedented insights and value creation opportunities.
What this level looks like
- Businesses reap the rewards of having a centralized intelligence platform with full visibility into existing and future operations.
- Infrastructure, services, and software are constantly monitored and improved as needed.
- Processes and workflows are developed and implemented to inform leadership about opportunities being identified throughout the company.
- Advanced monitoring and observability has become a source of sustained competitive advantage.
Capabilities required
- Staff with the necessary skills and time to extract actionable insights from the intelligence platform.
- Processes and workflows in place to facilitate the identification of opportunities for operational and efficiency improvements.
- Processes and workflows in place to communicate findings up to managers and executives.
- Performant analytics query language with high fidelity data science functions.
- High frequency, real-time streaming analytics.
- Anomaly and fault detection, outlier detection and trend analysis, and historical analytics.
Circonus Real-World Example
Major League Baseball unifies monitoring and observability to streamline operations, optimize performance, and generate revenue.
Many likely do not realize this, but Major League Baseball (MLB) is a complex technology company that not just broadcasts and live-streams baseball games but also real-time statistics for sports betting and fantasy league baseball. As a result, it’s collecting and monitoring a significant amount of data while aiming to provide seamless experiences for millions of consumers.
Over time, MLB’s software development teams became very siloed as each had different monitoring solutions and processes. This made it challenging for engineering management to gain comprehensive visibility, and each team was forced to ask another team for answers rather than have the ability to find it themselves. As a result, MLB chose to unify its monitoring with Circonus’ monitoring and observability platform, which MLB leverages for application, infrastructure, network, video, and Kubernetes monitoring.
Unification has allowed MLB to streamline monitoring processes across teams, enabling each team to benefit from the work and knowledge of one another — ultimately saving time and resources while improving productivity and results. Each IT department within MLB is able to more effectively solve problems or initiate new projects by learning how other teams have addressed similar issues.
Also, by democratizing its data — making it available to all teams and delivering it in a comprehensive, correlated way — MLB is gaining deeper insights and elevating the significance of its monitoring to overall business success. With all telemetry data in one place, MLB can now extract that data and correlate it with the various pillars of its business. The league can now visualize data or report on it or alert on it in a way that breaks down those legacy barriers in enterprise businesses.
MLB is also able to accurately and efficiently monitor the service levels across all of its APIs. The ability to keep track and meet the SLAs of all their clients, who depend on the ability to provide optimal viewing experiences for their over 100 million consumers, has a substantial direct effect on the organization’s bottom line.
This final step is not meant to be the end of the journey. Once a business achieves this level of sophistication, it must ensure all accomplishments in prior steps remain in place, while continuing to maintain a constant focus on data-driven improvement of processes and workflows throughout the business.

Summary
The possibilities of advanced monitoring and observability, across all sectors including gaming, streaming media, web conferencing, online businesses, finance, SaaS, telecom, and many others, are boundless — limited only by our creativity and imagination. As the number of systems and services we want to monitor and measure grows, and the amount of data they generate proliferates, we can only imagine what we will find and what we can create. Ultimately, however, we know that being smarter means making better decisions. It means that our decisions are driven by data that we can rely on for its accuracy and timeliness. It means that we have new knowledge that can drive competitive advantage and change the trajectory of our products, our operations, our IT infrastructure, and our business performance.
The companies that implement more advanced monitoring and observability and harness telemetry data to deliver exceptional customer experiences, optimize operations, innovate new products and services, and create entirely new revenue streams will be at a significant competitive advantage.